HTMLファイルは文字コードをシフトJIS、改行コードはCR+LFで保存すること。
<!DOCTYPE html>
<html>
<head>
<title>pp.134-137</title>
<!-- LeafletのCSS読み込み -->
<link
rel="stylesheet"
href="https://unpkg.com/leaflet@1.7.1/dist/leaflet.css"
integrity="sha512-xodZBNTC5n17Xt2atTPuE1HxjVMSvLVW9ocqUKLsCC5CXdbqCmblAshOMAS6/keqq/sMZMZ19scR4PsZChSR7A=="
crossorigin=""
/>
<!-- LeafletのJavaScript読み込み -->
<script
src="https://unpkg.com/leaflet@1.7.1/dist/leaflet.js"
integrity="sha512-XQoYMqMTK8LvdxXYG3nZ448hOEQiglfqkJs1NOQV44cWnUrBc8PkAOcXy20w0vlaXaVUearIOBhiXZ5V3ynxwA=="
crossorigin=""
></script>
</head>
<body>
<div id="map" style="height: 80vh;"></div>
<script>
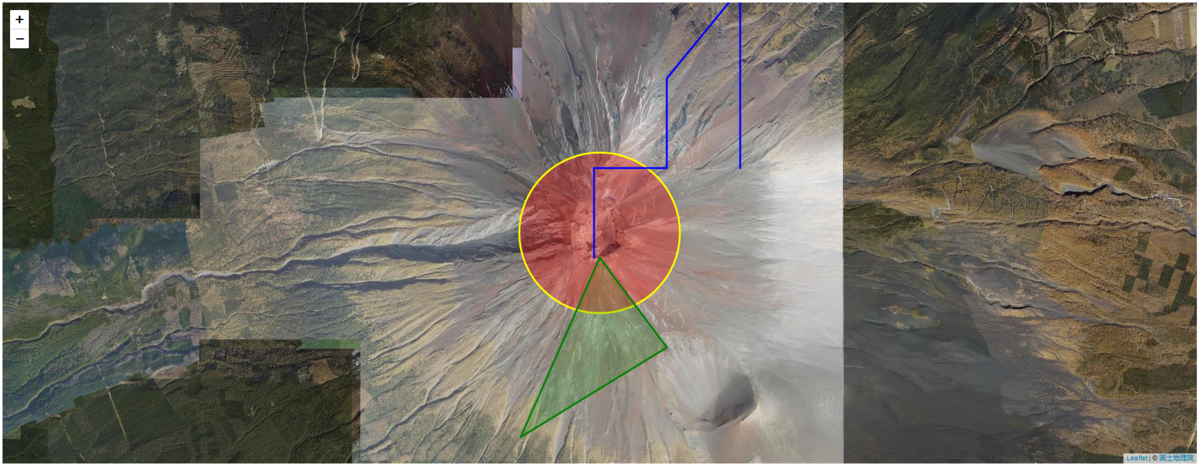
// 地図インスタンスを初期化 (=div要素に地図画像が埋め込まれる)
const map = L.map('map', {
center: [35.3627808, 138.7307908], // 富士山
zoom: 14,
});
const backgroundLayer = L.tileLayer(
'https://cyberjapandata.gsi.go.jp/xyz/seamlessphoto/{z}/{x}/{y}.jpg', // 地理院タイル空中写真
{
maxZoom: 17,
attribution:
'© <a href="https://maps.gsi.go.jp/development/ichiran.html">国土地理院</a>',
},
);
// 地図インスタンスへレイヤーを追加
map.addLayer(backgroundLayer);
// 円形
L.circle([35.3627808, 138.7307908], {
color: 'yellow',
fillColor: '#ff0000',
fillOpacity: 0.3,
radius: 1000,
})
.bindPopup('I am Circle!')
.addTo(map);
// 線分
L.polyline(
[
[35.36, 138.73],
[35.37, 138.73],
[35.37, 138.74],
[35.38, 138.74],
[35.39, 138.75],
[35.37, 138.75],
],
{ color: 'blue' },
)
.bindPopup('I am Polyline!')
.addTo(map);
// 多角形
L.polygon(
[
[35.36, 138.7307908],
[35.35, 138.74],
[35.34, 138.72],
],
{ color: 'green' },
)
.bindPopup('I am Polygon!')
.addTo(map);
</script>
</body>
</html>